Analyzing Neural Time Series Data, Part 1
Neuroscience as Source Separation
All of neuroscience is fundamentally just solving a problem of source separation. Take the visual cortex for example, you have multiple processes like visual processing and memory that take place at the same time, and so there are different sources that mixed together.
To understand this better, take a questionnaire for example. Let’s say we were trying to measure someone’s personality and attention through the same set of questions. Here attention, personality, and noise are the true sources or latent constructs. Now while answering each of the questions(sensors/manifest variables) all of these traits play some role or the other, and these can’t be directly measured. So as the outcome of the questionnaire we want to come up with accurate weights that take quantifiable values such as the answers of the questionnaire by someone and turn them back into the traits(sources/components/recovered sources that are estimated) we wanted to take a measure of.
To do this we use a variety of techniques:
- Anatomical source separation: Just study one part of the brain.
- Cognitive source separation: Design clever experiments to understand one specific aspect like short term memory without understanding the others.
- Temporal source separation
- Spatial source separation
- Statistical source separation: Using descriptive statistics.
Statistical source separation is about applying filters to the data: temporal/spectral and spatial filtering.
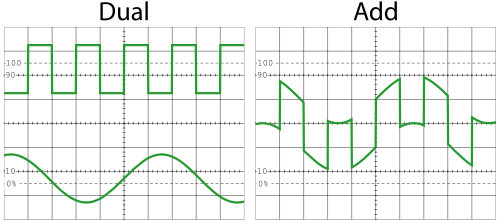
Temporal filtering is just taking all the time points in the original data, weighting them with a kernel and then summing them to find the final filtered signal. This happens over time over just one signal. Like one electrode’s signal over time.
Spatial filtering is the same but it happens over space on the same time point. Like taking the measure of 5 electrodes situated at different places at the same time and then filtering it with a kernel.
In this course we are going to learn how to to use spectral separation for separating two or more signals.
Origin, Significance, and Interpretation of EEG
The electrodes of an EEG when places on the scalp measure signals from not just one neuron but a lot of them, but this plays to our advantage. Most of these neurons act synchronously and also the very small electrical fields are generated by the synaptic currents in the pyramidal cells, only if a thousand of them contribute then we would have a signal large enough to reach the scalp surface.
The content of EEG show us electric signals which are supposed to relate to how cognition is given birth to. Based on these outputs of the EEG what can we say about the brain computations happening?
Advantages of EEG:
- It is a direct measure of electrical brain activity as neurons communicate with through electrical signals; EEG allows to record these signals non-invasively.
- It’s temporal resolutions and precision match the speed of cognition.
- EEG data is very rich and allows for physiological inspired analyses (oscillations, synchronization, connectivity, complexity/scale-free).
- It is one of the techniques that allow us to link findings across scale/methods/species.
The electrical activities in brains of most animals(rats, cats, rabbits, dogs, chimps, and humans) is found to be the same.
Disadvantages of EEG:
- It’s limited to large scale potentials, you can’t usually measure the the electrical activity of a single neuron from a EEG. Not all the computations in the brain happen at such large level scales.
- If the electrical signals in dipoles oppose each other then you won’t be able to measure the activity even when it is present.
- Uncertainties in anatomical localizations. Since we measure the EEG activity from outside then it becomes a question of where might the signals actually be originating from, so we have a couple of mathematical estimations to do this but there are uncertainties in this kind of anatomical localizations.
- Data, analyses , stats, and visualizations are complicated, time-consuming, and annoying.
- High temporal precision(could be good when you know when something happened in the experiment) and resolutions. When studying slower cognitive processes you might not know exactly when something happened and then the temporal precision is going to be a disadvantage.
Books
- Nature Neuroscience
- Thinking, Fast and Slow
Overview of Possible Preprocessing Steps
Preprocessing: time-consuming, tedious, not science, not fun, do it well and do it once.
Processing: hypothesis-driven, exploratory, the meat of science, fun, can be done multiple times.
Preprocessing steps:
- Import data to MATLAB
- High-pass filter(like .5Hz with a relatively low cut-off)
- Import channels locations(for topographical mappings)
- Reference EOG(eyes), EKG(heart), EMG(muscles)
- Epoch data around important events(trails of the stimulus): focus on the data that you want to pay attention to
- Subtract pre-stimulus baseline
- Adjust marker values
- Manual trial and rejection(remove trails that are artifacts or are unusual)
- Mark bad electrodes
- Average reference EEG channels(re-reference electrodes, make sure the reference electrode is clean and isn’t just one otherwise there might be bias, average it)
- Run ICA to clean data
Signal Artifacts (not) to Worry About
Manually look through all of your data to come to the conclusion of which artifacts to remove.
It’s something that requires skill and is sort of subjective. Just watch the video.
Topographical Mapping
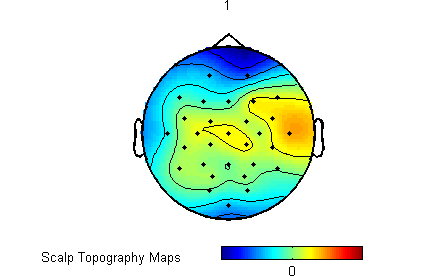
Topographical mapping is a great way to visualise EEG data. Here each point on the mapping corresponds to the location of the the electrodes on the scalp. Then because no data is calculated in between electrodes the colors over the entire region are calculated through interpolation, this allows for the colors to change smoothly from one electrode to the next.
These mappings can also help in recognizing noise and can be rendered to 3d.
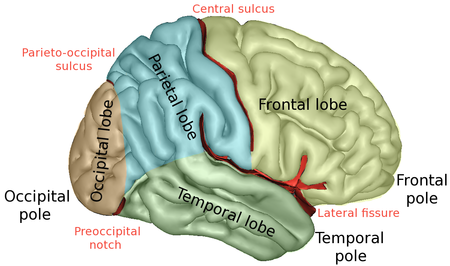
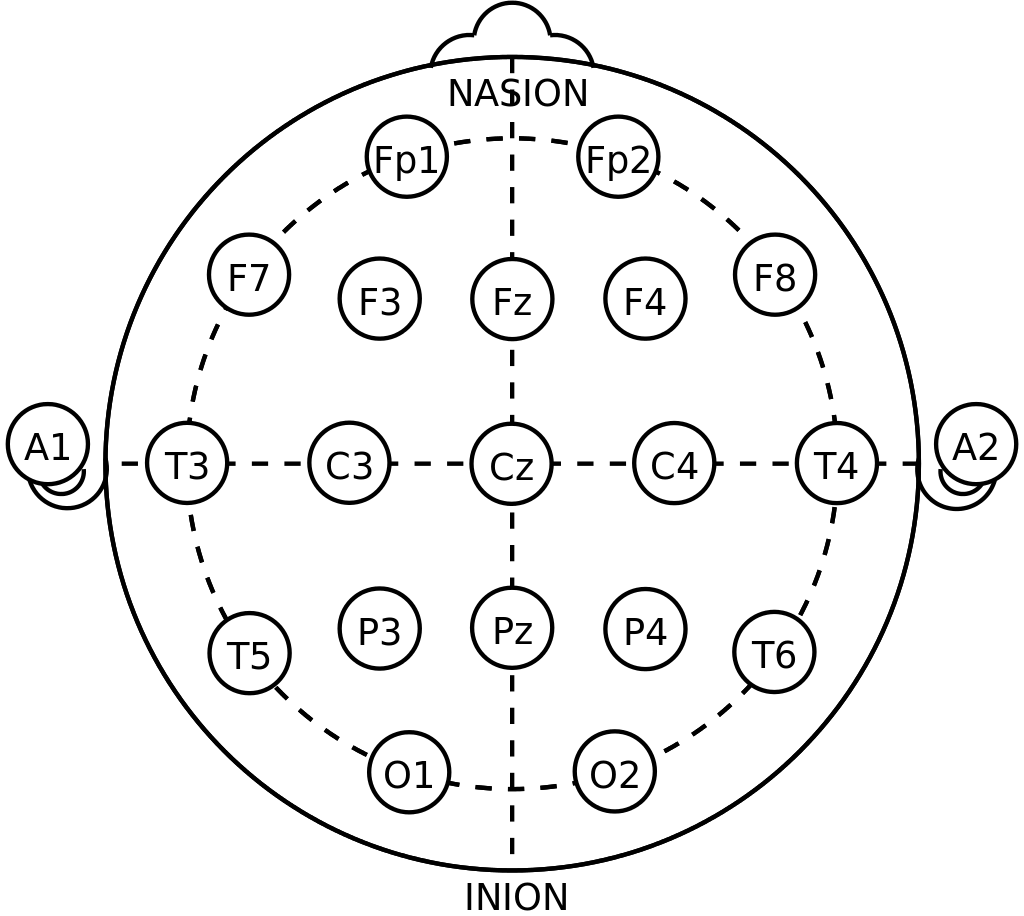
These electrodes in the EEG are labelled corresponding to the brain regions.
- F = frontal
- C = central
- T = temporal
- P = parietal
- O = occipital
-
A = aural(ears)
- Odd numbers = left hemisphere
- Z = center(zenith)
-
Even numbers = right hemisphere
- Fp1 = frontal pole 1(left)
- FC = channel between F and C
Overview of Time-Domain Analyses (ERPs)
ERPs(Event Related Potentials) don’t show the entire image of what could be happening as they are averaged out and lose a lot of data as well as noise. Furthermore the deflections could be non-phase locked thus they end up canceling out each other in the average. Whereas in the time-frequency analysis we don’t lose anything.
We shall not be taking this approach in the course.